Welcome to the Getting Started guide. Here you can learn about the basics of microbenchmarking, writing performance regression tests and using ScalaMeter in general. We start by explaining what microbenchmarking is in a nutshell and pointing out some of its important aspects.
If you already understand the underpinnings of microbenchmarking and want to jump right into coding, you can skip this section and go to Simple Microbenchmark.
Microbenchmarking
A microbenchmark is a measurement of the running time of some isolated piece of code. Typically, this is a method in your API, an operation on a data structure or an algorithm that you run against some input. The running time is usually measured in the order of milliseconds or less.
It’s important to point out that a microbenchmark typically does not reflect a real-world use-case of the algorithm or an API operation, since not all the real-world conditions can be replicated in a microbenchmark easily and its input data is usually synthetic.
Microbenchmarking on the JVM
You might expect that running a microbenchmark yields a precise information about the performance of a certain piece of code, and can be used to definitively determine its performance properties. After all, a microbenchmark focuses exclusively on one single snippet of code.
Alas, this is not at all so, for many reasons. The performance of a microbenchmark should be taken with a grain of salt – it only gives you some information about that particular snippet of code with those particular inputs in that particular runtime environment setup. We will take a look at some of the reasons why a microbenchmark does not give a complete information. Our focus is microbenchmarking on the JVM.
While it may come as a bit of a surprise that you cannot accurately measure performance, there are many examples in nature where this is the case. The Heisenberg principle in quantum mechanics is one such example. The principle states that you cannot accurately observe both the position and the momentum of a particle at the same time.
ΔxΔp ≥ ℏ / 2
This principle states that if the error particle position measurement gets lower, the error in its momentum measurement gets higher. You could completely accurately measure one of the two, but then you end up with no information about the other.
 </img>
But this is not the only example. In thermodynamics, taking a temperature reading gives you an inaccurate measurement because the measurement device transfers some of the heat to/from the object being measured. In biology, actions of animals at night can’t be observed precisely without light, and shining a light at them changes their behaviour. In psychology, an observer-expectancy effect causes the researcher to unconciously influence the participants of an experiment due to his own cognitive bias.
So, how does all this apply to the JVM, specifically?
There are many mechanisms in the JVM which are transparent to the programmer. Automatic memory management, dynamic compilation and adaptive optimization are just the main examples. Importantly, these mechanisms are triggered implicitly by the code being executed, and the programmer has little or no control over this.
Just in Time compilation. The HotSpot compiler continually analyzes the program performance for parts of the program executed frequently and compiles those parts down to machine code. Any part of the code can potentially be chosen for compilation at any point during the runtime, and this decision can happen in the midst of running a microbenchmark, yielding an inaccurate running time measurement. Also, portions of the program are periodically recompiled and can be deoptimized based on the JVM runtime information – during the runtime of the program, the same code might exhibit very different performance characteristics.
Classloading. Since the JVM, unlike a typical compiler, has global program information available, it can apply
non-local optimizations.
This means that a method may be optimized based on the information in some seemingly unrelated method.
One such example is inline caching, where the JVM can optimize and even
inline polymorphic method calls.
Since not all of the classes loaded in the complete application are loaded in a microbenchmark, many of the callsites
in a microbenchmark can and will be optimized, thus yielding an inaccurate running time measurement.
The bottomline is - seemingly unrelated code can have a big impact on performance of the code being benchmarked.
Automatic memory management. The microbenchmark is simply a piece of code running and measuring the running time of some other piece of code. As such, it may inadvertently leave the memory heap in a state which affects subsequent allocations or trigger a garbage collection cycle, each of which changes the observed performance of the code being tested. In the real-world application the state of the heap is unpredictable, and in general different heap states and allocation patterns tend to give very different performance results.
There are other non-JVM considerations to take into account as well. Specific processors, cache and memory sizes may show a very different performance for the same microbenchmark. On a single processor system, concurrently running applications or OS events can cause a degradation in performance. Different JRE versions may yield entirely different results. The important thing to note is that these effects do not cause a linear degradation in performance – decreasing the memory size twice might make your microbenchmark run a hundred times slower. You can experiment with this easily by decreasing the maximum heap size when running a JVM application.
Performance of some code is not some absolute scalar value denoting how fast the code is. Rather, it is some function which maps the inputs and the runtime conditions to a running time. This function is impossible to reproduce analytically.
In conclusion:
- microbenchmark conditions and inputs are hard to reproduce
- performance measurement in general introduces observer bias
- runtime behaviour is in general nondeterministic
- performance metrics such as running time inherently give an incomplete picture about the performance characteristics
A microbenchmark portrays neither the real-world behaviour of your code, nor does it result in a precise, reproducible performance measurement. So why is microbenchmarking still important?
It is important because it gives you some information about the performance characteristics of your code, in some particular conditions. This information might not be complete, but it can capture some of the characteristics that you are interested in. In particular, it can compare several implementations in some specific conditions leading you to a conclusion which is faster in those specific conditions. That may give you some idea of how your code behaves in some other set of conditions.
When to write a microbenchmark
To quote Donald Knuth:
We should forget about small efficiencies, say about 97% of the time: premature optimization is the root of all evil.
You should not attempt to optimize every single bit of your code, particularly when it comes to larger applications. Instead, you should stick to well defined programming principles such as composition, modularity or decoupling. In most cases you should only worry about asymptotic complexity of your program. Unless you know with certainty that a block of code is performance-critical, you should leave optimizations like loop unrolling, inlining, branch prediction or caching field accesses to compilers and JITs, both for maintenance and portability reasons.
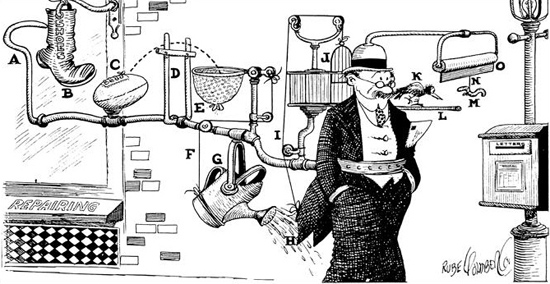
Otherwise, your code might end up looking something like the Rube Goldberg device below:
 </img>
The picture shows a device used to remind the wearer that a letter should be left in the letterbox. Needless to say, it is grossly complex, fragile and based on many assumptions, while having little or no benefits over carrying the letter in one’s hand.
That said, when do you want to write a microbenchmark? Here are some examples:
- optimize a known and well-established bottleneck in an application
- compare several implementation alternatives, e.g. several algorithms
- verify that an optimization is an optimization at all
- have a performance regression test for a particular piece of code
Often, a microbenchmark can give an answer to these questions to a certain extent.
Performance regression testing
To borrow a quote from Alfred North Whitehead:
Civilization advances by extending the number of important operations which we can perform without thinking about them.
In software development it’s important to do things automatically, because it saves time. Instead of invoking the compiler manually, the build tool does this for us when it detects changes. Instead of producing documentation and uploading it to a server, this is done automatically by deployment tools. Instead of manually running all the tests of a project with each changeset, this is done by continuous integration servers.
Having the tests being run automatically with each changeset ensures that some of the existing functionality hasn’t been (in)advertently lost. In serious software projects a changeset is automatically rejected if it does not pass the tests. The idea is to closely supervise what kind of changes go in, and what their effects are. A red flag is raised quickly if you try to do something you’re not supposed to.
 </img>
A snippet of code which tests a certain feature or functionality in an application which is known to have previously
existed is called a regression test.
Ideally, every feature should have a regression test and developers spend a great deal of time to write these.
But, is performance not a certain type of functionality too?
Why not write performance regression as well?
The reason this is done less often is because it is not easy to assess the correctness of a performance regression test. A typical unit test will invoke a certain method and compare its return value against a hardcoded expected value. Methods return the same value in all environments provided that the same preconditions (method arguments and global state) are met – in this sense, they are deterministic and reproducible, something we usually take for granted. Performance regression tests exhibit very different properties.
First, microbenchmark running times are not deterministic.
For example, a run A may have the running time 15ms and a subsequent run B the running time 16ms.
Does that mean that the run B is a performance regression?
Probably not.
The two alternative microbenchmarks have to be run more than once and a statistical analysis has to be applied to decide
if one of the alternatives is a regression.
Second, the running time of a certain benchmark is not reproducible on different machines, JVM versions or operating systems. This means that a tester cannot write a test where the running time is hardcoded into the test itself. Instead, preliminary benchmarks have to be executed on a particular machine on a particular operating system with a particular JVM version. The execution times of these preliminary benchmarks are then persisted for later comparison.
These two crucial differences between normal regression tests and performance regression tests are the reason why ScalaMeter exists – to allow you to write and run performance tests in a reliable manner, where the performance regressions can be detected deterministically and running times reproduced under the same conditions.
Now that we’ve covered all the theoretical aspects we need, it’s time to get practical and do some coding.