In this section we will see how to configure how performance tests are executed, how results are reported as well as tweak a range of test parameters selectively. Before we start, we note that we will be running all the tests from within an SBT project from now on. This might be a good idea to read up on SBT integration if you haven’t already.
Predefined configurations
Since ScalaMeter 0.5, the following predefined test configurations exist to help you get started quickly:
PerformanceTest.QuickBenchmark– Explained in detail in the simple microbenchmark section. Good for quick testing to get a feel for how long something takes.PerformanceTest.MicroBenchmark– Runs a separate JVM and logs outputs to console, but generates no HTML document and does no regression testing. Good for reliable and repeatable testing where micro-optimizations play a role.PerformanceTest.OnlineRegressionReport– Runs in a separate JVM, generates a HTML report ready to be hosted online, and does regression testing. Method of choice for continuous integration.PerformanceTest.OfflineRegressionReport– Runs in a separate JVM, generates a HTML report ready to be viewed in your browser fromfile://schema, and does regression testing. Ideal for local development on existing codebase when source code changes must not cause performance regressions.PerformanceTest.OfflineReport– Runs in a separate JVM, generates a HTML report for offline viewing in the browser, and does no regression testing. Ideal when developing a new codebase or tweaking the code to understand performance impacts.
Simply extend one of these traits to start writing the test with the desired functionality. If you would like to customize your test further, read on.
Execution
To have a better grasp on how ScalaMeter works, it’s important to understand its test execution pipeline. This pipeline conceptually consists of 4 major parts which are executed in the following order:
- Defining tests with a DSL
- Executing tests with an executor
- Reporting test results with a reporter
- Persisting test results with a persistor
To explore these parts in more depth, we will modify the RangeBenchmark
from the Simple benchmark section.
We focus on the executor part first.
We will no longer inherit the PerformanceTest.Quickbenchmark class,
but PerformanceTest directly.
Doing this requires that we manually define three parts of the testing pipeline,
namely, the members executor, reporter and persistor.
import org.scalameter.api._

object RangeBenchmark extends PerformanceTest {

  /* configuration */

  lazy val executor = LocalExecutor(
    new Executor.Warmer.Default,
    Aggregator.min,
    new Measurer.Default)
  lazy val reporter = new LoggingReporter
  lazy val persistor = Persistor.None

  /* inputs */

  val sizes = Gen.range("size")(300000, 1500000, 300000)

  val ranges = for {
    size <- sizes
  } yield 0 until size

  /* tests */

  performance of "Range" in {
    measure method "map" in {
      using(ranges) in {
        r => r.map(_ + 1)
      }
    }
  }
}
We’ve configured these three parts in exactly the same way as they are defined in the previously
inherited PerformanceTest.Quickbenchmark class.
The executor decides how the tests are executed, how the measurements are done and how the results
are interpreted.
We intend to run the tests in the same JVM instance as ScalaMeter, so we instantiate a LocalExecutor.
We want to take the minimum running time of all the benchmarks run for each size, so we set the
Aggregator for the executor to Aggregator.min.
We just want to do a fixed number of measurements for each size, so we set
the Measurer to Measurer.Default.
The reporter creates reports based on the results – we want to output results to the terminal,
so we instantiate the LoggingReporter.
The persistor saves the results of the test.
We don’t need this functionality right now, so we just use Persistor.None, which does absolutely
nothing.
We can now run the benchmark in SBT as follows:
> test-only sctest.RangeBenchmark
[info] Compiling 1 Scala source to /tmp/test/target/scala-2.10/test-classes
[info] ::Benchmark Range.map::
[info] jvm-name: Java HotSpot(TM) 64-Bit Server VM
[info] jvm-vendor: Oracle Corporation
[info] jvm-version: 23.0-b16
[info] os-arch: amd64
[info] os-name: Mac OS X
[info] Parameters(size -> 300000): 5.0
[info] Parameters(size -> 600000): 10.0
[info] Parameters(size -> 900000): 15.0
[info] Parameters(size -> 1200000): 20.0
[info] Parameters(size -> 1500000): 25.0
Whoa!
What happened just now?
We are still running the benchmark on exactly the same machine and environment as before, but it seems
that the running times have changed by a factor of more than 2 with respect to the run from the
previous section:
Parameters(size -> 300000): 2.0
Parameters(size -> 600000): 4.0
Parameters(size -> 900000): 7.0
Parameters(size -> 1200000): 16.0
Parameters(size -> 1500000): 30.0
Could it be that we somehow incorrectly configured the test?
A quick revert of our recent inheritance changes would reveal that’s not the case.
So what could it be?
An answer might sound surprising.
The difference between the two runs is that in the previous section we’ve run the test directly
from the command-line, and now we run it in the same JVM instance in which SBT is running.
SBT loads a lot of different classes into the JVM, many of which may change how our benchmark
code is compiled, whereas running the benchmark through command-line loads only the bare
essentials needed to run ScalaMeter.
Code in some of the SBT classes may be preventing the JIT compiler to apply some optimizations
to our code.
Orthogonal to that, the two JVM instances have entirely different heap sizes – notice
how the performance was linear when running from SBT, while it degraded in the previous benchmark
for larger Ranges, indicating that memory allocations took more time on average.
To ensure that the tests are run in a separate JVM, we only need to change the executor
to a special SeparateJvmsExecutor. This executor will start at least one new JVM instance
for each test and run the tests from the new JVM.
The new JVM has the default heap size set to 2GB.
This way:
lazy val executor = SeparateJvmsExecutor(
  new Executor.Warmer.Default,
  Aggregator.min,
  new Measurer.Default
)
Running the test from SBT now yields the following output:
> test-only sctest.RangeBenchmark
[info] ::Benchmark Range.map::
[info] jvm-name: Java HotSpot(TM) 64-Bit Server VM
[info] jvm-vendor: Oracle Corporation
[info] jvm-version: 23.0-b16
[info] os-arch: amd64
[info] os-name: Mac OS X
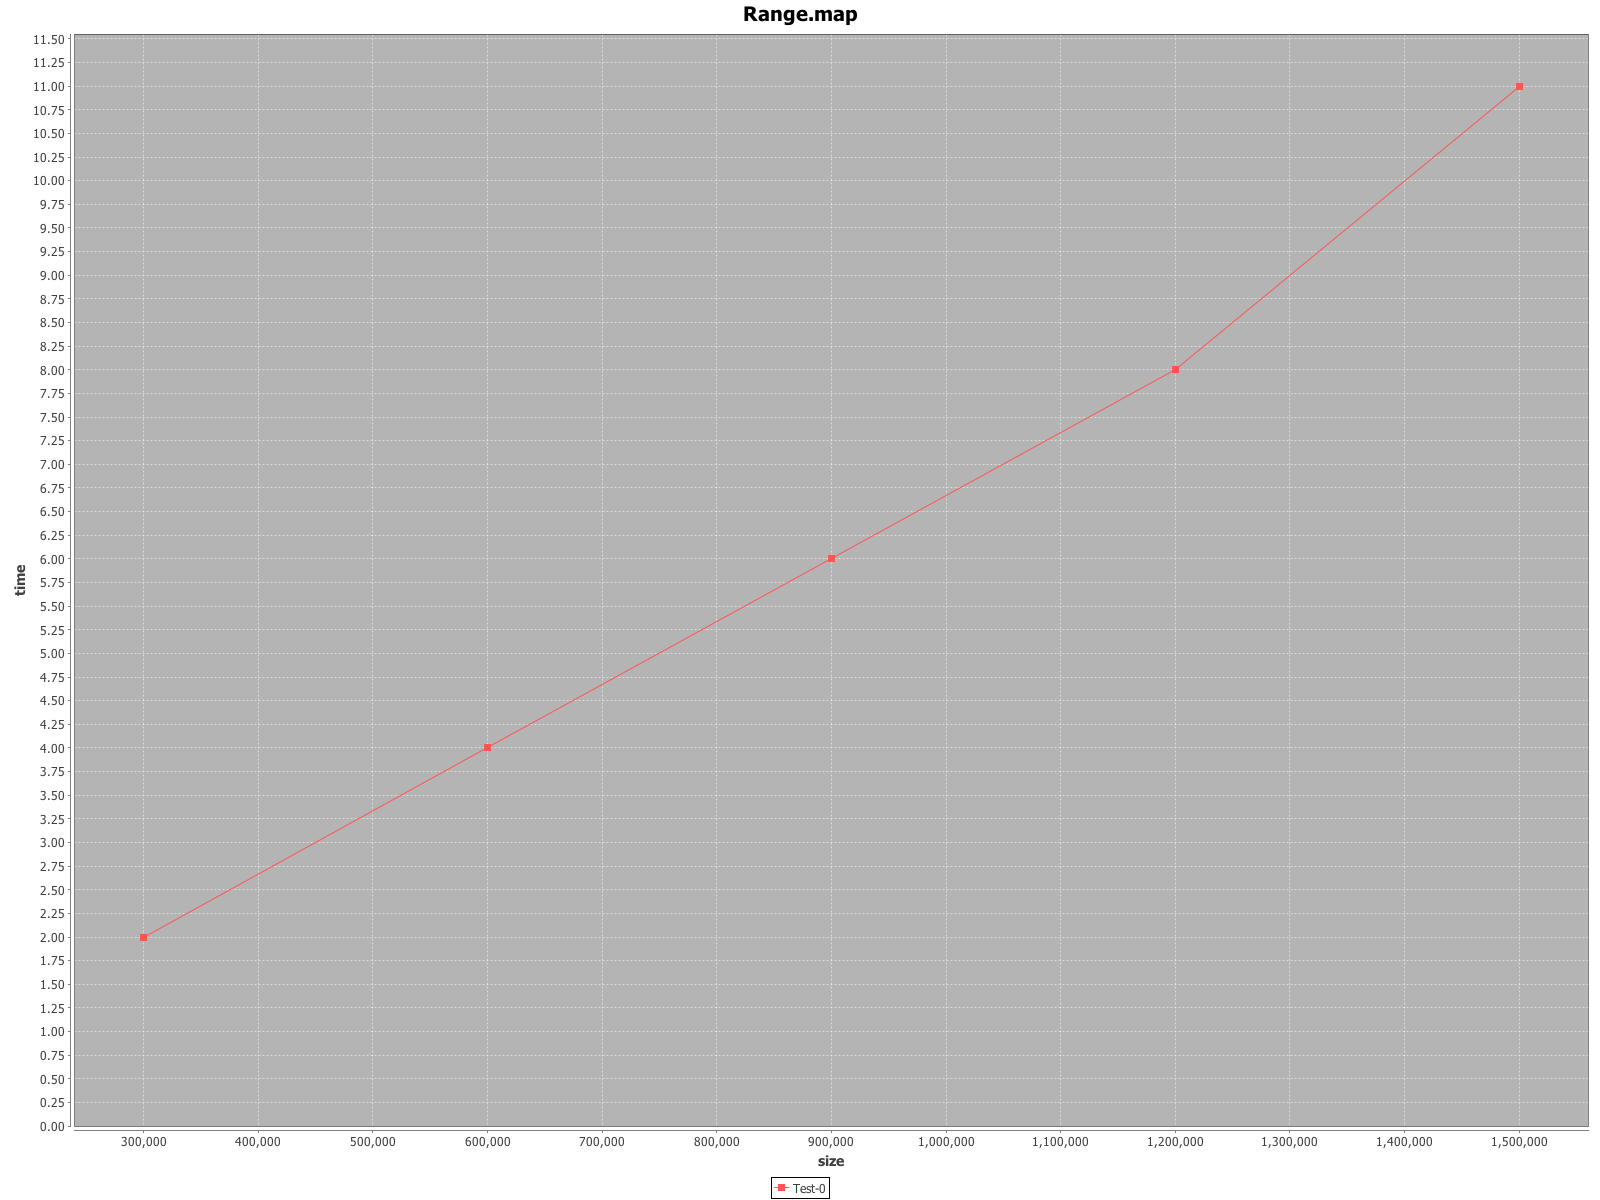
[info] Parameters(size -> 300000): 2.0
[info] Parameters(size -> 600000): 4.0
[info] Parameters(size -> 900000): 6.0
[info] Parameters(size -> 1200000): 9.0
[info] Parameters(size -> 1500000): 11.0
We’ve just eliminated both effects seen earlier.
First, the Range code is optimized better just like in the earlier command-line example.
We can notice this with the smaller ranges.
Second, the scaling is now linear just like in the SBT example.
This becomes apparent with the larger ranges.
Note
Again, these tests were taken on a 4-core 3.4 GHz i7 iMac, Mac OS X 10.7.5,
JRE 7 update 9 and Scala 2.10-RC2.
The SBT heap size was set to 4GB, and the scala runner script default heap size
is 256MB for Scala 2.10-RC2.
Depending on your machine and environment, you might get very different results
than the ones above.
The example above serves to demonstrate just how fragile benchmarking on the JVM is,
even with relatively simple code.
An additional observation is that the Range class behaves very differently depending
on the program in which it is used.
We will use the SeparateJvmsExecutor unless we say otherwise, since its results are the
easiest to reproduce.
We remarked above that each executor takes additional 2 parameters, namely, the
Aggregator and a Measurer.
We will get back to them later in this overview.
Reporting
A terminal is nice, but wouldn’t it be even nicer to have a chart mapping each range
size to a running time?
We just need to change the LoggingReporter with the ChartReporter which generates
PNG image files with charts for each test.
lazy val reporter = ChartReporter(ChartFactory.XYLine())
The ChartReporter constructor takes several parameters, the most important of which is
the ChartFactory.
The same test data can be presented in many different ways – as a histogram, confidence
interval comparison, a 3D chart, and so on.
These are described in more detail in the Reporters section.
We want a simple XY line chart now, so we create a ChartFactory.XYLine() object.
Running the benchmark from SBT like before will not produce any terminal output.
Instead, a PNG file like the one below is generated in the tmp directory
(click to enlarge).
 </img>
You can configure in which directory the tests are generated by setting the resultDir
argument when you run the test:
> test-only sctest.RangeBenchmark -- -CresultDir tmp1
Note
When running from the command-line, simply pass any arguments as command-line arguments, after the name of the test (i.e. your main class).
Now the test results are generated into a new subdirectory tmp1.
The reports.resultDir is a global test parameter, so it can only be set when you start the
tests.
Unlike the resulting directory, other test parameters can be configured hierarchically
and selectively for each test, rather than once globally.
Configuring parameters
We now take a look at configuring test parameters selectively. Here, “selectively” means that you can specify different test parameters for each test group, or even curve, separately. This allows you to most appropriately tweak your tests.
First lets switch back to the LoggingReporter.
To make output simpler, also switch to LocalExecutor again.
Then, we run the tests with an additional argument -verbose.
> test-only sctest.RangeBenchmark -- -verbose
This produces a lot of output. We can divide the output into four main parts. First comes the global warmup:
[info] Starting warmup.
[info] 0. warmup run running time: 76 (covNoGC: NaN, covGC: NaN)
[info] 1. warmup run running time: 54 (covNoGC: 0.239, covGC: 0.239)
...
[info] 11. warmup run running time: 52 (covNoGC: 0.066, covGC: 0.285)
[info] Steady-state detected.
[info] Ending warmup.
As mentioned before, we need to ensure that the JIT compiler optimized our
code appropriately.
ScalaMeter monitors the running time during the warmup to dynamically detect
if the running time has become stable.
The initial warmup done by LocalExecutor runs all the warmups for all the tests,
ensuring that all the classes are loaded.
In this case we only have a single test, but in general changing the order of the
tests without loading classes for all the tests might result in entirely different
running times – remember, we’re running these tests in the same JVM.
Next comes a warmup before each test:
[info] Running test set for Range.map, curve Test-0
[info] Starting warmup.
[info] 0. warmup run running time: 60 (covNoGC: NaN, covGC: NaN)
...
[info] 20. warmup run running time: 30 (covNoGC: 0.060, covGC: 0.354)
[info] Steady-state detected.
[info] Ending warmup.
This warmup works in the same way as the previous one. Once the warmup for a specific test ends, the measurements are taken:
[info] 36 repetitions of the snippet starting.
[info] measurements: 6, 6, 7, 6, 6, 6, 6, 6, 6, 6, 6, ...
[info] Repetitions ended.
[info] 36 repetitions of the snippet starting.
[info] measurements: 10, 11, 11, 11, 11, 11, 10, 11, 11, ...
[info] Repetitions ended.
[info] 36 repetitions of the snippet starting.
[info] measurements: 16, 17, 17, 18, 16, 17, 16, 17, 16, ...
[info] Repetitions ended.
[info] 36 repetitions of the snippet starting.
[info] measurements: 37, 22, 21, 22, 21, 22, 22, 21, 22, ...
[info] Repetitions ended.
[info] 36 repetitions of the snippet starting.
[info] measurements: 27, 27, 27, 27, 27, 27, 27, 27, 27, ...
[info] Repetitions ended.
We can see above that the LocalExecutor by default does 36 repetitions of a
measurement for each input size before moving on to benchmarking bigger ranges.
Finally, the already well-known output of the LoggingReporter is displayed:
[info] ::Benchmark Range.map::
[info] jvm-name: Java HotSpot(TM) 64-Bit Server VM
[info] jvm-vendor: Oracle Corporation
[info] jvm-version: 23.0-b16
[info] os-arch: amd64
[info] os-name: Mac OS X
[info] Parameters(size -> 300000): 5.0
[info] Parameters(size -> 600000): 10.0
[info] Parameters(size -> 900000): 16.0
[info] Parameters(size -> 1200000): 21.0
[info] Parameters(size -> 1500000): 27.0
The verbose output of this test is fairly simple – more complex executors and
Measurers can produce a much more intricate output as we will see later.
But, what if we feel that 36 measurements are way too many and we are simply
wasting time doing them?
After all, we are only taking the minimum of all the observed running times, and
we can see above that even after the first few measurements this minimum
running time is reached.
We can set the number of measurements in a specific test group or for a specific
curve using the config keyword:
performance of "Range" in {
  measure method "map" config (
    exec.benchRuns -> 15
  ) in {
    using(ranges) in {
      r => r.map(_ + 1)
    }
  }
}
Here we’ve set the exec.benchRuns parameter to 15 for every curve in the test group
Range.map.
We can notice that the test became slightly faster, but along with it, so did the
probability the we will find those minimum times which give a nice linear curve
we’ve seen before:
[info] Parameters(size -> 300000): 6.0
[info] Parameters(size -> 600000): 12.0
[info] Parameters(size -> 900000): 18.0
[info] Parameters(size -> 1200000): 21.0
[info] Parameters(size -> 1500000): 27.0
Play with this by setting the exec.benchRuns to 64!
You can also try setting the exec.minWarmupRuns and exec.maxWarmupRuns to
see how it affects the test results.
The test parameters are organized hierarchically.
For example, all the parameters which have something to do with test execution
will begin with the exec prefix.
There are many different parameters you can configure – we will enumerate them
as we describe different parts of the pipeline.
In the next section we talk in more detail about generators.
Writing larger test suites
What if you have a larger test suite consisting of multiple test classes and each test class has a different executor?
For example, some tests could measure the memory footprint, while others could measure the running time.
In this case you have the option of using the include keyword, which includes the test cases from the referenced test classes.
Importantly, these test classes can define separate executors used by their respective test cases – for each test case
the include directive will ensure that the executor of the respective test class is used.
However, the persistor and reporter values are overridden by the include directive – only the persistors
and the reporters from the enclosing class are used.
In the following example we have two test classes that define separate executors.
class RegressionTest extends PerformanceTest.OfflineReport {
  val sizes = Gen.range("size")(1000000, 5000000, 2000000)
  val arrays = for (sz <- sizes) yield (0 until sz).toArray

  performance of "Array" in {
    measure method "foreach" in {
      using(arrays) config (
        exec.independentSamples -> 6
      ) in { xs =>
        var sum = 0
        xs.foreach(x => sum += x)
      }
    }
  }
}

class MemoryTest extends PerformanceTest.OfflineReport {
  def persistor = new persistence.SerializationPersistor
  override def measurer = new Executor.Measurer.MemoryFootprint

  val sizes = Gen.range("size")(1000000, 5000000, 2000000)

  performance of "MemoryFootprint" in {
    performance of "Array" in {
      using(sizes) config (
        exec.benchRuns -> 10,
        exec.independentSamples -> 2
      ) in { sz =>
        (0 until sz).toArray
      }
    }
  }
}
The enclosing class may look like this – in this case it turns off the persistors for the included tests.
class TestSuite extends PerformanceTest.OfflineReport {
  def persistor = Persistor.None

  include[MemoryTest]
  include[RegressionTest]
}